
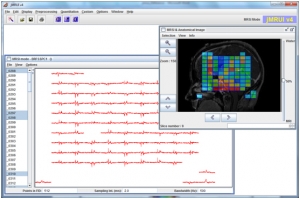
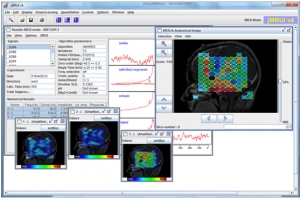
The project was carried out with a dual objective: to develop a rich graphical interface to visualize MR (Magnetic Resonance) data and results from various quantization algorithms, and to integrate analysis algorithms developed in C and Fortran into the graphical interface.
Total project duration : 72 months
The total cost of the project was 1000 man.days
Details of the project :
Problematic
The interest of the project is to be able to provide a medical/non-university population with algorithms for the analysis of in-vivo MR data in the time domain. Strong constraints of simplicity, user-friendliness, but also of performance and relevance of the results led the realization of this project.
Mission statement
Tana Corp was in charge of both the development of the graphic core of the jMrui application, but also of the integration of the work of its scientific collaborators.
We also provided consulting and training throughout the initial project and the subsequent European project.
Organization
For the realization of the project, 3 persons have been allocated :
This contract was executed entirely with Tana Corp resources dedicated to the project.
Main characteristics of the client
This project was initially conducted for the Creatis-LRMN laboratory of the University Lyon 1.
The Creatis-LRMN laboratory is a medical imaging research unit whose international influence and fields of excellence are linked to the intersection of two major axes which are:
It was then taken up within the framework of the European project eMrui funded by the Marie Curie Actions network.


Conduct of the project
Solution features
Business processes covered by the solution
What were the most difficult features to implement ?
Managing very heavy data and moving from large data structures to Fortran algorithms. High memory consumption.
Solution: Data slicing before quantization and JNI (Java Native Interface) call.
Technical platform elements
Software package, software or development languages used
Graphical interface and basic filters in Java/SWING. Complex algorithms in C/Fortran.
Reasons for the choice
Share of pre-existing developments used on which the Supplier has capitalized to complete the project.
Challenges and key success factors
Business result
Today the application has been taken over within the framework of the European research project network eMrui.
It is directly maintained and improved by a consortium of 16 partners and used by more than 1400 research organisations in 53 countries.

 BIOMERIEUX – OTP automation